How to work with vfxAlert stock signals
There is always something happening in the trading world. Traders invent new strategies, and the programmers offer the new soft for traders. However, the newcomer should be prudent and not buy himself on the promises of easy profit. Before using the certain application or the forex signal, the trader should check the reviews about the broker or software. On the internet there are many suppliers who offer to buy the stock signals, but the quality of these signals is far from perfect.
The good news is that now the traders don't need to waste their time checking the reviews and searching for the reputable signal suppliers. Now they can work with vfxAlert. This software was developed to simplify the work of traders concerning data analysis. vfxAlert has various analytical instruments which collect and analyze the information from the stock signals. Let’s see how this application works
A signal is a suggestion for entering a trade on a currency pair, usually at a certain price and time. Stock signals give an indication of when to trade on the foreign exchange market based on technical analysis. Detailed and intelligible structure of signals allows the trader to estimate the market information correctly and to take the right decisions. Now, let’s look at the structure of vdxAlert signals
Structure of vfxAlert signal
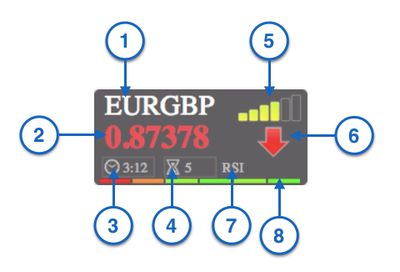
2. Price — price when a signal emerges. For adaptive algorithm is the open price of the current candle.
3. Time — time when a signal emerges. For adaptive algorithms the time since the last update.
4. Expiration — time of signal’s expiration.
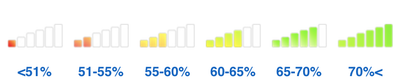
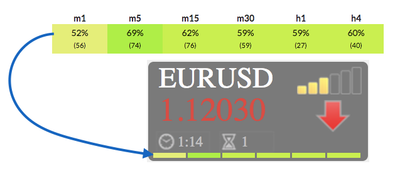
5. Power — number of profitable options in the past with current combination of indicators.
6. Signal — CALL or PUT options.
7. Algorithm — algorithm of signal generation.
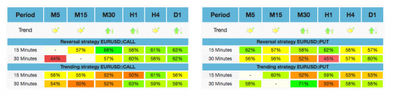
8. Heatmap — Statistical winning percentage calculated for the values of the technical indicator on a different timeframes.
The signals are formed basing on three types of algorithms: trending, reversal and adaptive. Algorithm is the sequence of actions whom the stock signals submit.
Trending. Algorithm uses the following technical indicators to generate signals:Commodity Channel Index, Relative Strength Index.
Reversal. Algorithm uses the following technical indicators to generate signals: Parabolic SAR, Moving Averages.
Adaptive. Algorithm uses the statistical analysis of historical details. Adaptive strategy shows the most favorable moment for entering the market.
What is heatmap and signal power?
There are two ways for working with the vfxAlert — Free account and Pro account. On the free account the trader works with signal without payment. Free account suits for training the trading skills and to elaborate the trading strategy. Here you can subscribe on free account and to get acquainted with vfxAlert.
On the Pro account the trader receives the additional analytical instruments such as trend indicator, online chart, economic calendar, signals statistic, signal power and heatmaps. Here you can learn about the payment conditions for the Pro account.
To access the heat maps, use the toolbar on the bottom.
- RSI — Relative strength index for 12 time periods.
- ATR — Average True Range for 12 time periods.
- Force — Force Index for 12 time periods.
- Bears — Bears Power for 12 time periods.
- Bulls — Bulls Power for 12 time periods.
- sRSI — Relative strength index for 4 time periods.
- sATR — Average True Range for 4 time periods.
- sBears — Bears Power for 4 time periods.
- sBulls — Bulls Power for 4 time periods.
Learn more about the work of heatmap here
Is vfxAlert worth it?
Of, course, YES. But remember, key to successful trading is the working strategy and the knowledge. In trading, it is always a positive thing to have your own view, and not to rely blindly on the tips of someone else. Use the stock signals as part of your own trading strategy and choose the trustworthy broker. Remember, your success is in your hand.